Product Pricing Analytics: Using Data to Improve Your Strategy
06/08/2026
11 min read

Margin leakage often appears as small discounts, off-invoice rebates, or renewals that fall below the list price. By the time finance notices at quarter close, the loss is already in the numbers. Product pricing analytics alerts you early, helping you make every deal, offer, and renewal more profitable.
This guide gives you the four types of pricing analysis, the ten metrics that matter, and a clear path from scattered data to smarter pricing decisions.
Key highlights:
- Product pricing analytics is the practice of applying descriptive, diagnostic, predictive, and prescriptive analyses to your company’s data to improve your strategy.
- Pricing analytics platforms pull in cost data from every source, segment your customers and products, run price waterfall analysis, and build guardrails directly into your CPQ workflows.
- Conga Price Optimization and Management connects segmentation, waterfall diagnostics, AI recommendations, and CPQ guardrails so pricing data reaches sellers at quote time.
What Is Product Pricing Analytics?
Product pricing analytics is what turns raw market data into profitable growth. It brings together transaction history, competitive benchmarks, and cost structures to show how and where buyers respond to price changes.
This unified product pricing view replaces scattered spreadsheets with clear, actionable signals. It alerts you when a deal goes below the floor, finds renewal uplift opportunities, and highlights the discounts that maximize margin. With these signals linked to governance rules, your team can negotiate with numbers that protect your P&L.
Why Product Pricing Analytics Is Important for Enterprise Strategies
Pricing is the most powerful lever in your commerce chain. For enterprise leaders managing complex product lines and contracts, being able to analyze and adjust costs quickly is the baseline for profitable growth.
Deloitte found that 86% of CFOs expect pricing to grow in importance over the next 12 months, and 54% cite the lack of a cohesive strategy as their biggest obstacle to adjusting costs quickly.

Pricing analytics software replaces guesswork with a clear, auditable layer that brings together cost inputs, market conditions, account segments, and competitive positioning. For enterprise teams, this visibility leads to:
- Margin protection: identify and eliminate the silent discounts that erode deal economics.
- Deal velocity: give sales teams defensible, pre-approved price points that move at the pace of opportunity.
- Contract accuracy: align deal terms with the actual cost to serve to prevent billing errors that compound at quarter close.
The 4 Types of Data Analytics for Pricing
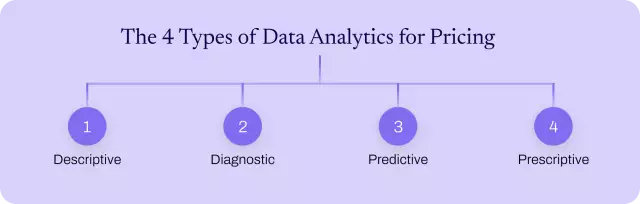
Data analytics for pricing works across descriptive, diagnostic, predictive, and prescriptive methods. Each one builds on the last, moving from understanding past performance to guiding real-time pricing decisions.
1. Descriptive: analyzing historical pricing trends
Descriptive analytics answers the big question: what happened to your prices, margins, and win rates in past cycles? It pulls years of transaction data from your CRM and ERP to map price points and sales performance across your business.
A descriptive analysis of pricing helps you spot sales leaks that your revenue and finance teams can prioritize and solve:
- A distributor segment discounting six points deeper than policy allows
- A product line that never renews above the list price
- A region still operating on a price floor set three years ago
2. Diagnostic: identifying drivers of pricing and margin changes
Diagnostic analytics explains why your margins changed. It's your main tool for a deep dive, starting with the list price and then subtracting all discounts, freight allowances, and promotional costs to show your true profits. At this stage, you can identify cost drivers like:
- A product mix shift pulling the average selling price down
- A sales rep who is discounting harder in the final week of the quarter
- A rebate structure compounding off-invoice in ways the P&L never fully captures
- A channel that consistently undercuts the list without triggering any approval workflow
Analytics solutions like Conga Price Optimization build interactive waterfalls that let analysts pivot by segment, product, or rep in real time, so the diagnostic work happens in the tool rather than in a spreadsheet built after each quarter closes.
Experience an end-to-end pricing optimization process with Conga POM
3. Predictive: forecasting price elasticity and demand
Predictive analytics shows you what is likely to happen if a price changes, reps offer a discount, or a contract comes up for renewal. It uses historical transaction patterns and live market signals to forecast cost elasticity, deal win probability, and demand sensitivity at the segment or account level.
Neural networks for B2B pricing support predictive models by tracking interactions across many variables that simpler methods, such as rule-based pricing tiers, static discount matrices, or spreadsheet estimates, cannot capture:
- Input costs: the raw material, logistics, and supply chain expenses that set the floor on any viable price
- Competitive positioning: where a company’s prices sit relative to market alternatives in a given segment or geography
- Customer tenure: how long an account has been under contract and what that history reveals about their price sensitivity and renewal behavior
- Channel behavior: the pattern of discounting, margin erosion, and list price adherence across direct, distributor, and partner channels
- Seasonal demand shifts: predictable fluctuations in purchase volume tied to calendar cycles, budget periods, or industry-specific buying patterns
4. Prescriptive: optimizing pricing decisions in real time
Prescriptive analytics takes the output of predictive work and converts it into a specific price recommendation. It pairs AI-driven insights with your specific business guardrails and real-time cost signals to deliver the winning estimate for every quote or renewal. For enterprise revenue leaders, that means every rep enters a negotiation with a number the business can defend.
Learn how explainability in AI-powered pricing works.
How to Use Pricing Data to Improve Your Business Pricing Strategy
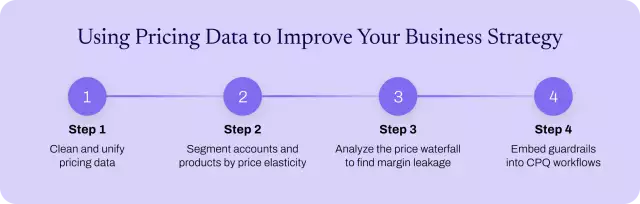
Pricing analytics only makes a difference when the insights reach the seller, the contract, and the renewal offer in time to influence the buyer’s decision. These key steps help close the gap between analysis and a closed deal:
Aggregate and cleanse pricing data across CRM, ERP, and billing systems
Pricing data usually sits in different sources. List prices concentrate in ERPs, negotiated quotes in CRMs, realized deals in billing, and rebate accruals in finance spreadsheets. BCG found that 33% of 400 surveyed industrial goods companies still manage pricing in Excel, meaning a third of them make margin decisions on data nobody has reconciled.

Here’s what you need to do to produce a single source of truth for advanced pricing strategies:
- Pull the information from your ERP, CRM, and billing systems into one place
- Cleanse the combined dataset by removing duplicate records, correcting mismatched customer and product IDs, standardizing inconsistent formats, and flagging outliers that could skew calculations built on them
- Once the data is clean, match records on shared customer and product IDs and normalize currency, unit of measure, and time dimensions across all sources
Segment accounts and products by price sensitivity and price elasticity
According to an Adobe survey, 57% of B2B respondents offer account-specific pricing, reflecting the importance of optimization. With segmentation, you group accounts across five dimensions:
- Volume tier: the total purchase volume an account commits to annually, which determines how much pricing leverage they have earned and where their floor price should sit
- Industry: the vertical a accounts operate in, which shapes their cost structure and competitive environment
- Geography: the region or market where the transaction occurs, which affects local competitive dynamics, currency exposure, and regulatory constraints on pricing
- Buying channel: whether the customer purchases directly, through a distributor, or via a partner, since each channel carries different margin expectations and discount norms
- Historical price response: how the account has reacted to past price changes, including whether they renegotiated, accepted, reduced volume, or churned, which is the strongest predictor of future pricing
Conduct price waterfall analysis to map and model margin leakage
A price waterfall analysis allows you to visualize the full pricing journey from list price to true pocket margin. Follow these two steps to conduct this mapping:
- Start with the list price for the transaction and subtract each value-reducing element in the order in which it actually occurs: on-invoice discounts first, then off-invoice rebates, freight allowances, payment-term adjustments, and promotional costs.
- Check if each deduction has these three things attached to it: the dollar or basis-point value, the team or role that approved it, and the contract clause or policy that authorized it.
Once you map the full waterfall, use it to locate where revenue leakage is structural and where it is situational:
- Structural leakage recurs across accounts and periods, such as a rebate tier that always compounds beyond its intended ceiling or a freight allowance that sales approves by default rather than as an exception.
- Situational leakage is tied to specific deals or reps, such as a one-time concession that sets a precedent.
Act on insights by embedding price guardrails into CPQ workflows
To put the insights you get from your analytics solution into practice, connect your price engine to your configure, price, quote (CPQ) tool so that recommendations and guardrails appear within the quoting workflow.
See how to embed the price guardrails into a CPQ tool like Conga:
- Configure floor prices by segment so the system blocks any discount that would breach the margin policy before the quote leaves the rep's screen
- Set deal scoring to surface next to the discount field, enabling reps to see the win probability impact of a concession before they offer it
- Set route exceptions automatically, allowing quotes within approved price bands to clear without manual review, and quotes outside them to escalate to the right approver
Key Metrics to Track for Product Pricing Analysis
To protect margins against market volatility in the long term, follow these key price analytics metrics:
| Price Metric | What It Measures | How to Track It |
| Price Realization | Percentage of list price captured on average, after discounts and rebates | Divide actual transaction cost by list price per deal and segment by product, channel, and region to pinpoint where list price adherence is failing |
| Pocket Margin | Revenue minus all cost-to-serve, including freight, terms, and rebates | Subtract all on-invoice and off-invoice deductions from the list price to express pocket margin in dollars and percentages by segment |
| Price Dispersion | Spread of prices paid by similar customers for the same product | Calculate the standard deviation of transaction prices for identical SKUs and flag outliers beyond one standard deviation for immediate deal desk review |
| Discount Effectiveness | Incremental revenue generated per dollar of discount given | Group deals into discount bands to identify the effectiveness ceiling where win rates stop rising as discount depth increases |
| Price Elasticity | Change in demand per 1% change in price, by segment | Divide percentage volume change by percentage price change per segment, updating results quarterly as new transaction data accumulates |
| Win Rate by Price Band | Deal win percentage by price-to-target ratio | Assign deals to specific price bands and track win percentages over rolling quarters to identify where price becomes a barrier to closing |
| Average Discount Depth | Mean discount by product, segment, and rep | Average the discount percentage per transaction by rep or region and compare against approved ceilings to flag activity operating outside of policy |
| Floor Price Compliance | Percentage of deals closing at or above the approved floor | Compare transaction amounts against segment-specific floors to calculate compliance percentages by individual rep and approver |
| Margin Contribution by Segment | Absolute margin dollars per customer or product segment | Subtract COGS from revenue by segment and rank results in absolute dollars to surface segments with the highest disproportionate P&L impact |
| Contract Renewal Uplift | Price increase captured on renewal, net of churn risk | Compare renewed contract values against expiring values per period to identify where sales teams are leaving pricing headroom on the table |
Get ready for quarterly reviews with board-level pricing metrics.
Power Your Price Analytics with Conga
Identifying where margins are leaking with pricing analytics is only half the work. Conga Price Optimization and Management gives your teams the tools to act on those findings, guiding them through interactive waterfall analytics, real-time visibility into discounts and cost drivers, and AI-powered insights built into pricing workflows.
See what Conga POM offers you:
- Drill into margin performance by customer, product, or region to uncover where revenue is slipping through inconsistent discounts or unapproved channel pricing
- Model price change scenarios before deploying them, with real-time visibility into how adjustments affect key performance indicators
- Embed AI-driven cost guidance into pricing strategies to protect margins even as costs shift.
Turn pricing diagnostics into protected margins with Conga POM. Contact our sales team to centralize your pricing intelligence, automate governance, and stop revenue leakage across every channel.
See how Conga POM turns pricing data into measurable margin gains
Frequently Asked Questions
-
How does real-time data analytics influence price optimization?
Real-time data analytics influences price optimization by narrowing the gap between when market conditions shift and when prices reflect those changes. Analytics solutions for optimizing pricing use AI to recalculate recommendations within seconds of a change in cost, competitors, or demand, so you don’t need to wait for quarterly reviews.
-
How do analytics solutions support data-driven pricing optimization?
Analytics solutions support data-driven pricing optimization by unifying cost, account, competitor, and sales data into one reliable view, then using AI to identify the best price points for each product, segment, or deal. The best analytics platforms also push pricing recommendations into tools like Conga CPQ, so sellers quote faster, protect margins, and make informed decisions based on current data.
-
How can organizations use pricing data to improve performance?
Organizations can use pricing data to improve performance by identifying the specific pricing levers that affect revenue, margin, and win rates. For example, if historical deal data shows that a 10% discount closes deals at the same rate as a 6% discount, the extra four percentage points represent avoidable margin loss.
By analyzing discount patterns, account segments, product performance, and deal outcomes, you set better price floors, reduce unnecessary discounting, improve renewal pricing, and give sellers clearer guidance before quotes go out.
-
How long does it take to implement pricing analytics for an enterprise organization?
Enterprise pricing analytics implementations typically take three to nine months, depending on the company’s data readiness. Deployments on a unified enterprise revenue management platform like Conga happen faster because quoting, contracts, and approval workflows operate on the same data layer, eliminating the need to rebuild deal data across separate tools.
-
The Executive’s Guide to AI Pricing Optimization GuidesCPQThe Executive’s Guide to AI Pricing Optimization
How AI pricing optimization transforms forecasting accuracy and protects revenue.03/10/20261 min read -
From Pricing to Profitability: How AI is Reshaping B2B Decision-Making BlogAIFrom Pricing to Profitability: How AI is Reshaping B2B Decision-Making
Discover how AI pricing is reshaping B2B decision-making—from improving speed and margin consistency to building trust and smarter commercial strategies.04/09/20266 min read -
Pricing Metrics That Matter: What Boards and Investors Care About BlogIndustry InsightsPricing Metrics That Matter: What Boards and Investors Care About
Boards and investors are demanding smarter pricing. Learn the AI-driven pricing metrics leaders must track to protect margins and drive growth.04/13/20268 min read -
Building CFO Buy-in for Pricing Transformation BlogAIBuilding CFO Buy-in for Pricing Transformation
Under pressure to deliver growth, CFOs are turning to AI pricing. Discover how modern pricing improves margins, forecasts, and governance.04/14/20268 min read