Pricing Opportunity Framework: See What You’re Leaving on the Table
03/30/2026
2 min read
Use this framework to quantify pricing leakage from static lists, discount drift, and legacy terms—showing how these factors compound over time and highlighting the areas you should prioritize.

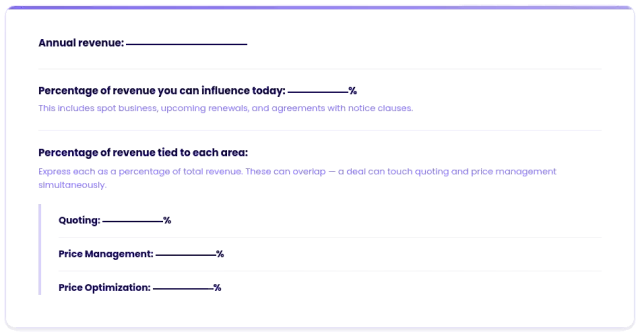
Step 1: Gather Your Inputs
This step helps you capture the core inputs needed to produce a directional estimate of pricing leakage. Enter your annual revenue, the share of revenue you can influence today, and the percentage of revenue that moves through quoting, price management, and price optimization.
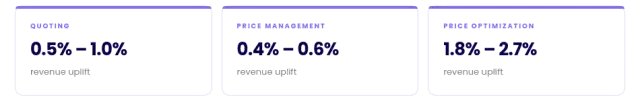
Step 2: Apply Expected Impact Ranges
These ranges represent observed outcomes from pricing execution improvements — not projections. Applying them helps you quantify the magnitude of leakage based on the percentage of revenue tied to each pricing workflow.
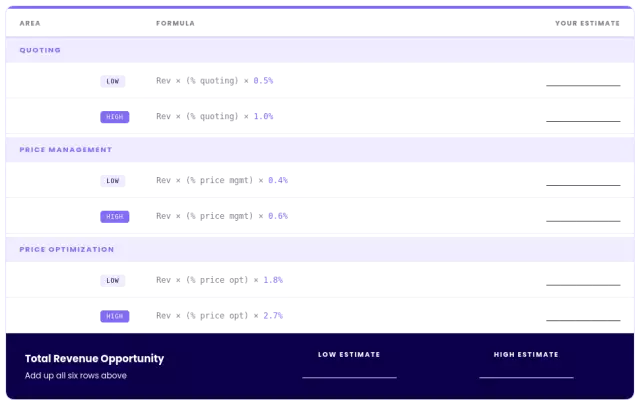
Step 3: Calculate Your Potential Impact
Combine your inputs with the impact ranges to estimate the total revenue currently slipping through pricing processes. Add the low and high ranges across each area to see your directional estimate.
Methodology note: Uplift ranges reflect benchmarks across pricing optimization implementations. Results vary by business model, pricing maturity, and market conditions. Use these figures to orient a conversation, not to set a budget.'
What Your Number Means
This number estimates the annual revenue you could unlock by improving pricing execution—capturing value already in your business that’s often lost to quoting variance, discount leakage, and suboptimal pricing—and shows how even modest improvements can drive meaningful impact.
Important Note: The monetary revenue calculation is an estimate based on current assumptions and available data. Actual results may vary due to factors such as market conditions, operational changes, and unforeseen circumstances. This calculation is provided for informational purposes only and should not be considered a guarantee of future performance. We recommend conducting a detailed analysis before making financial decisions.
Example: What This Looks Like In Dollars
A $500M manufacturer with 40% of revenue running through pricing workflows found $4.5M–$7.4M sitting unrecovered. See their calculations below.
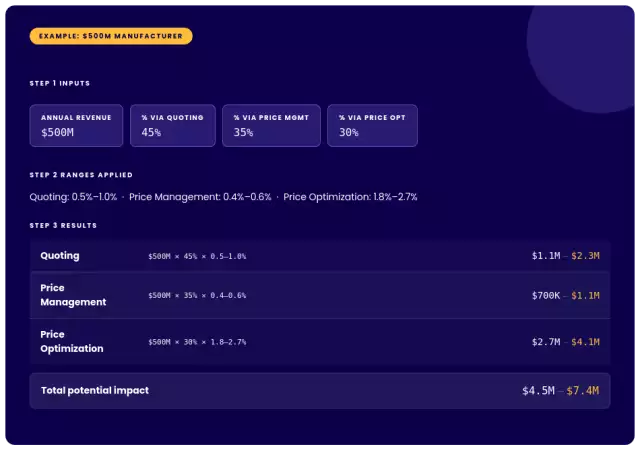
These results are not from new customers or new products, they're from fixing how pricing already works.
SEE YOUR REAL NUMBER
Uncover the leakage hiding in your deals and the gaps impacting your bottom line.
Related Resources
-
G2 Enterprise Grid Report for Pricing Analyst ReportAIG2 Enterprise Grid Report for Pricing
Learn why Conga Price Optimization was named a Leader by G2.03/18/20262 min read -
The Executive’s Guide to AI Pricing Optimization GuidesCPQThe Executive’s Guide to AI Pricing Optimization
How AI pricing optimization transforms forecasting accuracy and protects revenue.03/10/20261 min read -
Commercial Operations Maturity in 2026 GuidesAICommercial Operations Maturity in 2026
Benchmark your commercial operations and uncover where AI gaps impact revenue03/10/20263 min read